6. A figure for a paper
A figure in a paper is usually several panels: a measurement over its residuals, a second view of the same system, a zoom. Marey composes figures into one grid, letters the panels, and draws the grid as the journal's box.
Panels. a |> Chart.above b puts a over b, and a |> Chart.beside b puts b to the right
of a. Both take figures of any shape, so a panel beside a stack of two runs the height of both.
The panels are one grid: the room each needs for its ticks, titles, legend and colorbar is made the
same along each grid line, so plots in a column share their left and right edges and plots in a
row their top and bottom. A layout that does not nest is drawn as a picture,
Chart.mosaic "AAB;DEB;DCC" [ 'A', …; 'B', … ], each character a cell and . an empty one.
Proportions and sharing. withRowHeights [| 3.0; 1.0 |] draws the first row's plots three
times as tall as the second's, whatever their gutters, and withColWidths does the same for
columns. shareX gives every panel so far one x domain and writes its tick labels and title only
on the lowest panel of each column; shareY and shareAxes likewise. A shared axis of two
dimensions is refused when the panels are joined. withEqualAspect makes a unit as long on y as on
x, for a map, an orbit or a field, and withBoxAspect holds the plot at a stated shape.
Insets and letters. withInset (x0, y0, x1, y1) fig draws a one-panel figure over the last
panel, its plot at those fractions of the host's plot, and withInsetZoom marks the inset's domain
on the host. withPanelLetters LetterParen letters the panels (a), (b), … in reading order
when the figure is drawn.
Themes. A theme is a record of resolved values: Theme.modern, the default, for a screen;
Theme.publication, serif, framed, with ticks inside on all four sides, as physics journals print
a figure; Theme.tikz, the same for a LaTeX document, with siunitx units; Theme.notebook,
Theme.presentation and Theme.dark. They are adjusted rather than forked, Theme.modern |> Theme.withPalette … |> Theme.scaleType 1.15, and each can be measured for contrast. The default
palette is Okabe and Ito's, reordered; Palette.validate simulates three kinds of colour blindness
and reports the worst separation and contrast against a background.
for theme in [ Theme.modern; Theme.publication; Theme.dark ] do
    let report = Theme.validate theme
    printfn "%-12s text contrast %5.2f, axes %5.2f, passes: %b" report.Theme report.TextContrast report.AxisContrast report.Ok

let onWhite = Palette.validate Color.white Palette.okabeIto
printfn "Okabe–Ito on white: lowest contrast %.2f, passes: %b" onWhite.MinContrast onWhite.Ok
Okabe–Ito fails on white: its colours stay apart under every colour blindness, but its yellow is 1.32 : 1 against white. The themes do not change the palette, which would stop it being Okabe–Ito; they order it so the light colours come last, and are validated against the background they are drawn on.
One oscillator, four panels
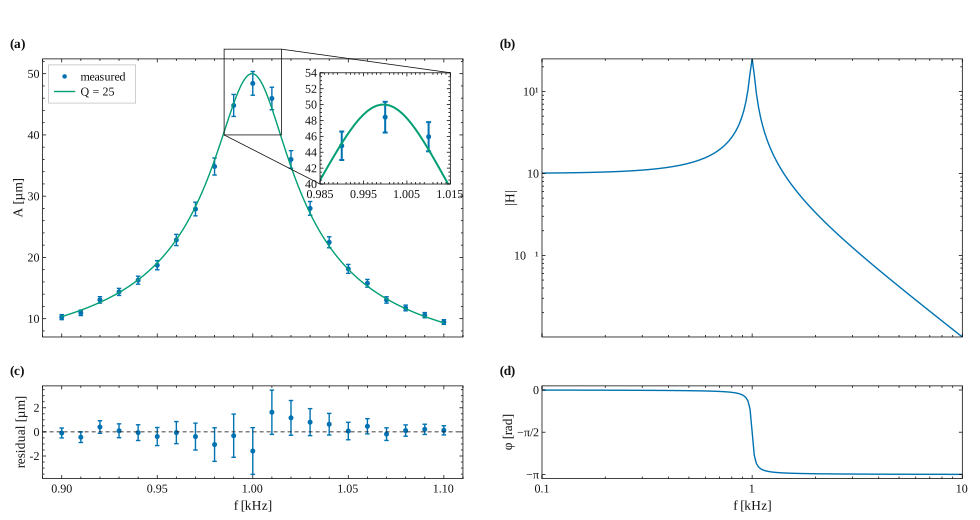
§3's oscillator, as a paper would show it. On the left the measurements over the model, with the residuals below, sharing the frequency axis at three to one, and an inset on the peak. On the right, the transfer function: gain over phase, on a log frequency axis.
let residualsFigure =
    Chart.errorbarIn U.hertz U.metre drive (Array.map2 (fun a f -> a - response 25.0 f) amplitude drive) amplitudeErr
    |> Chart.addHLine U.metre 0.0<m>
    |> Chart.withXLabel "f"
    |> Chart.withYLabel "residual"

let peakInset =
    Chart.errorbarIn U.hertz U.metre drive amplitude amplitudeErr
    |> Chart.addLineIn U.hertz U.metre sweep (sweep |> Array.map (response 25.0))
    |> Chart.withXDomain 985.0 1015.0
    |> Chart.withYDomain 40e-6 54e-6
    |> Chart.withAxesLook AxisUntitled

let measurement =
    Chart.errorbarIn U.hertz U.metre drive amplitude amplitudeErr
    |> Chart.withName "measured"
    |> Chart.addLineIn U.hertz U.metre sweep (sweep |> Array.map (response 25.0))
    |> Chart.withName "Q = 25"
    |> Chart.withYLabel "A"
    |> Chart.withLegend LegendTopLeft
    |> Chart.withInset (0.66, 0.55, 0.97, 0.95) peakInset
    |> Chart.withInsetZoom
    |> Chart.above residualsFigure
    |> Chart.shareX
    |> Chart.withRowHeights [| 3.0; 1.0 |]

let transferFrequencies = Array.init 201 (fun i -> 100.0<Hz> * 10.0 ** (float i / 100.0))
let transferGain (f: float<Hz>) = response 25.0 f / a0

let transferPhase (f: float<Hz>) =
    let r = f / f0
    -(atan2 (r / 25.0) (1.0 - r * r)) * 1.0<rad>

let transfer =
    Chart.lineIn U.hertz U.one transferFrequencies (transferFrequencies |> Array.map transferGain)
    |> Chart.withXLog
    |> Chart.withYLog
    |> Chart.withYLabel "|H|"
    |> Chart.above (
        Chart.lineIn U.hertz U.radian transferFrequencies (transferFrequencies |> Array.map transferPhase)
        |> Chart.withXLog
        |> Chart.withYTicksNamed U.radian [| 0.0<rad>, "0"; -halfTurn / 2.0, "−π/2"; -halfTurn, "−π" |]
        |> Chart.withXLabel "f"
        |> Chart.withYLabel "φ"
    )
    |> Chart.shareX

let paperFigure =
    measurement
    |> Chart.beside transfer
    |> Chart.withPanelLetters LetterParen
    |> Chart.withTheme Theme.publication

paperFigure
The same value goes into a paper as TikZ, typeset by the document under Theme.tikz, or as a
vector PDF:
let paperSize = Chart.size 980.0 520.0

paperFigure |> Chart.withTheme Theme.tikz |> Chart.toFile TikzBackend.render "oscillator.tex" paperSize
paperFigure |> Chart.toFileBytes SkiaBackend.renderPdf "oscillator.pdf" paperSize

printfn "oscillator.pdf: %d bytes" (System.IO.FileInfo "oscillator.pdf").Length
TikzBackend.Preamble is the four \usepackage lines the document needs.