1. Start
In a script or a notebook, one line brings the library:
#r "nuget: Marey"
#r "nuget: Marey.Backend.Skia"

open Marey
open Marey.UnitsOfMeasure
Marey is units, the plotting grammar, fields, simulations, animation, live figures, and SVG,
TikZ and HTML output. Marey.Backend.Skia adds PNG and PDF; it is a separate reference because it
brings SkiaSharp's native libraries. In a project, the same two packages:
dotnet add package Marey
dotnet add package Marey.Backend.Skia
In a Verso notebook, the first cell also loads the extension that displays a figure as a figure. Verso fetches it from nuget.org and asks once before loading it:
#!extension Marey.Verso
open Marey.UnitsOfMeasure puts the guide in the mode where every axis takes a unit and the
compiler checks it. Without it a chart takes plain numbers and a unit is optional; §2 shows both,
and §14 the C# spelling.
Every fsharp block in this guide runs, in order, as one session: the test suite reads the pages,
runs them under dotnet fsi, and draws each figure shown under a block from that block. A name
bound in one section is still there in the next.
A first figure
A ball dropped from rest, timed at six heights by a light gate, against ½ g t²:
let tGate = [| 0.1<s>; 0.2<s>; 0.3<s>; 0.4<s>; 0.5<s>; 0.6<s> |]
let xGate = [| 0.051<m>; 0.193<m>; 0.447<m>; 0.779<m>; 1.232<m>; 1.759<m> |]
let xErr = Array.create 6 0.02<m>

let g = 9.81<m/s^2>
let tModel = Array.init 61 (fun i -> float i * 0.01<s>)
let xModel = tModel |> Array.map (fun t -> 0.5 * g * t * t)

let fall =
    Chart.lineIn U.second U.metre tModel xModel
    |> Chart.withName "½ g t²"
    |> Chart.addErrorbarIn U.second U.metre tGate xGate xErr
    |> Chart.withName "light gate"
    |> Chart.withTitle "A dropped ball"
    |> Chart.withLegend LegendBest

fall
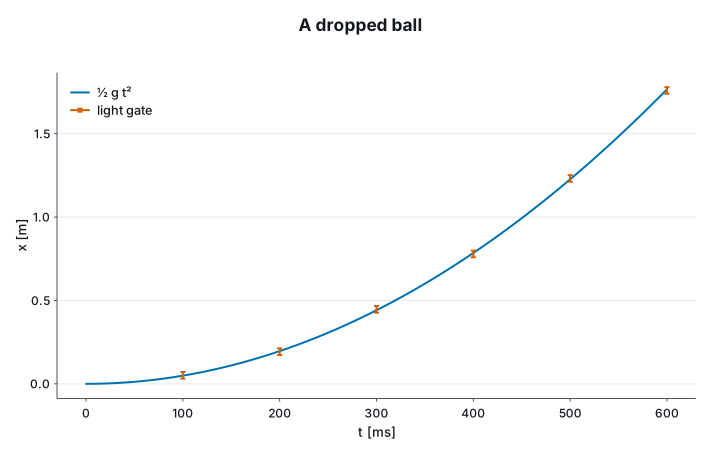
Nothing set the axes. U.second and U.metre say what each axis is, and from them and the data
the figure takes its titles, its ticks and its prefixes: the drop lasts 0.6 s, so the time axis
reads t [ms] from 0 to 600. The legend comes from the two names, and LegendBest puts it in the
corner the data leaves emptiest. xModel was never declared a length: 0.5 * g * t * t is a
float<m> because g is in m/s² and t in seconds, and putting it on a seconds axis would not
compile.
A chart takes any sequence of values: an array, a list, a ResizeArray, a seq. It reads the
sequence once, when it is built, and keeps its own copy, so changing the array afterwards leaves
the figure as it was.
The same figure, four ways
A figure is a value. Each output is a renderer applied to it at a size:
let size = Chart.size 720.0 450.0

fall |> Chart.toSvg SvgBackend.render "fall.svg" size
fall |> Chart.withTheme Theme.tikz |> Chart.toFile TikzBackend.render "fall.tex" size
fall |> Chart.toFileBytes SkiaBackend.renderPng "fall.png" size
fall |> Chart.toFileBytes SkiaBackend.renderPdf "fall.pdf" size

let tex = System.IO.File.ReadAllText "fall.tex"
printfn "the TikZ axis titles use siunitx: %b" (tex.Contains @"\qty{")
fall.tex is a tikzpicture for a LaTeX document. Under Theme.tikz its text is typeset by the
document, in the document's font, and the units in the axis titles by siunitx. The PNG and the
PDF are drawn by Skia, which shapes their text with HarfBuzz. §6 makes a figure for a paper out of
this one.