Marey


Figures, fields, simulations and animations for F#, where the compiler checks the units and the axes label themselves.
Named for Étienne-Jules Marey (1830–1904), who invented the graphical method in experimental science: record a physical quantity as a curve against time, and read the physics off the curve.
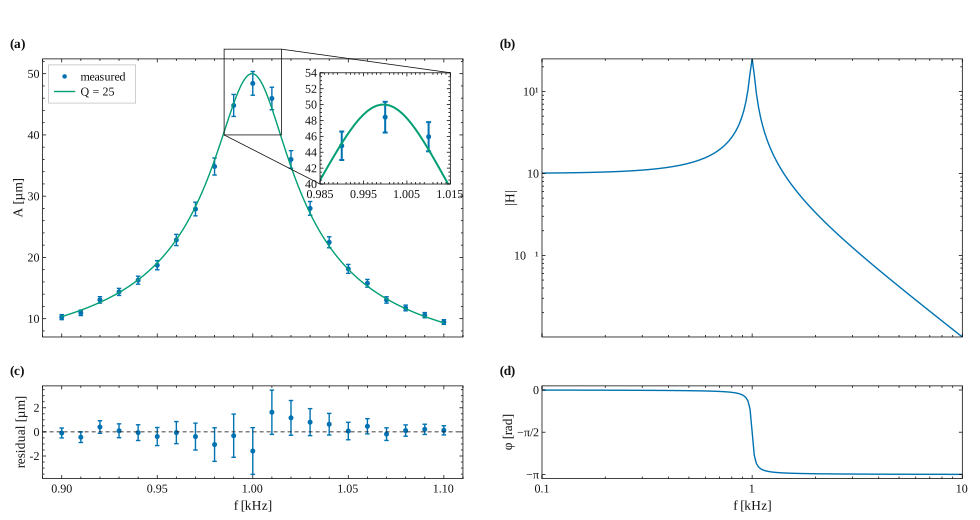
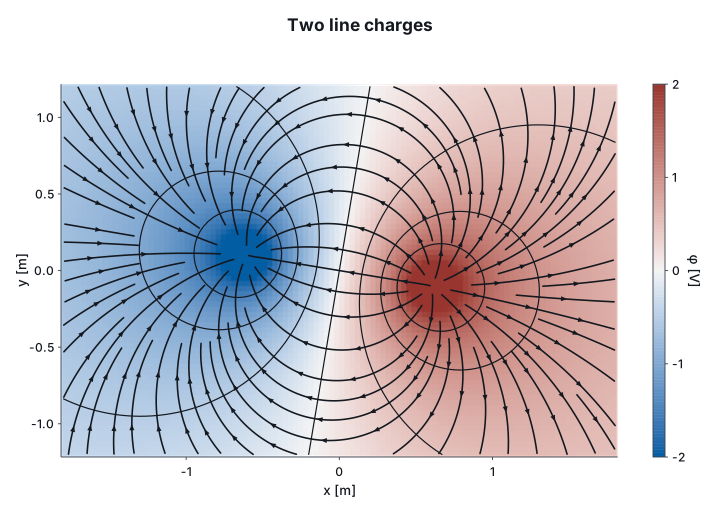
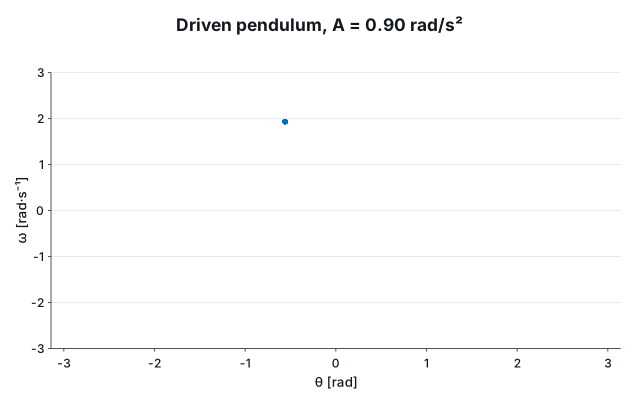
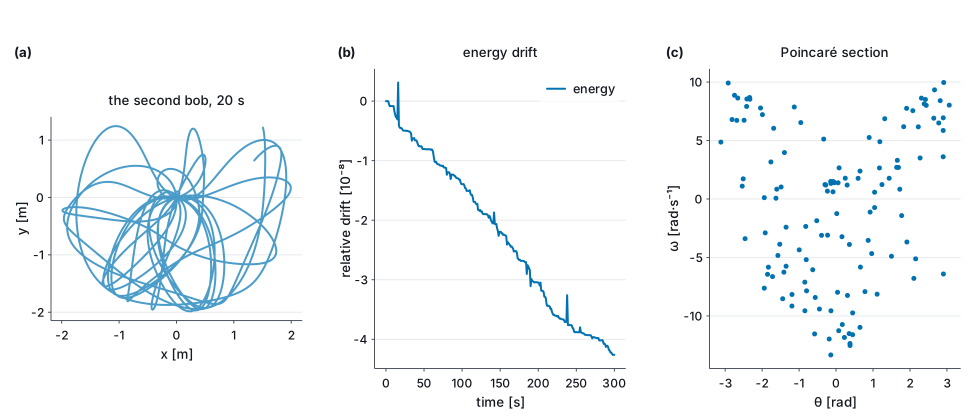

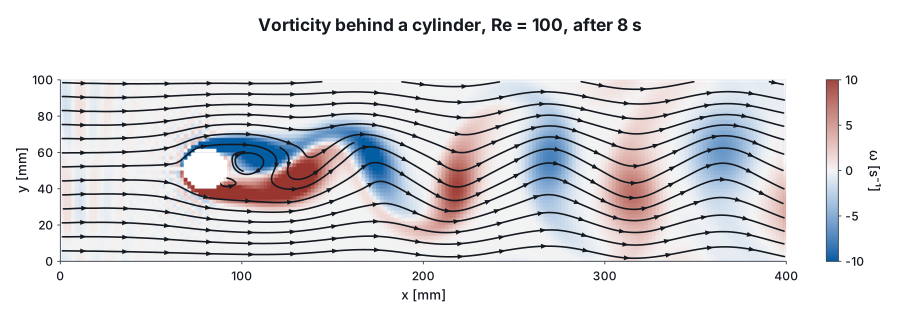
Each picture is drawn by the code in the guide above it, and the test suite redraws them all and fails when one no longer matches.
The idea
A chart takes a unit witness for each axis, U.second, U.metre, and the compiler checks it
against the data's units of measure. From the witness and the numbers the figure takes everything
else: the axis titles, the SI prefix, the ticks, the unit a statistic comes out in, and the check
that two series on one axis agree. Plotting seconds against a metres axis does not compile. The
same idea runs through the rest: a field's gradient is in the units the types work out, a slider
over kelvin hands the view a temperature, and an integrator checks that an acceleration is one.
Install
dotnet add package Marey
or #r "nuget: Marey" in a script. Marey brings units, figures, fields, simulations, animation,
live figures, and SVG, TikZ and HTML output. PNG and PDF are Marey.Backend.Skia; a window and the
GPU are Marey.Backend.Gpu; typeset text and video are Marey.Tools.Tex and Marey.Tools.Video.
In a Verso notebook, a first cell of
#!extension Marey.Verso makes a figure display as a figure and a figure with controls live.
A damped spring
#r "nuget: Marey"

open Marey
open Marey.UnitsOfMeasure

let t = Array.init 400 (fun i -> float i * 0.01<s>)
let x = t |> Array.map (fun t -> 0.012<m> * exp (-t / 1.5<s>) * cos (2.0 * System.Math.PI * 1.2<Hz> * t))
let stiffness = 40.0<N/m>

let spring =
    Chart.lineIn U.second U.metre t x
    |> Chart.above (Chart.lineIn U.second U.joule t (x |> Array.map (fun x -> 0.5 * stiffness * x * x)))
    |> Chart.shareX
    |> Chart.withTitle "A damped spring"

spring
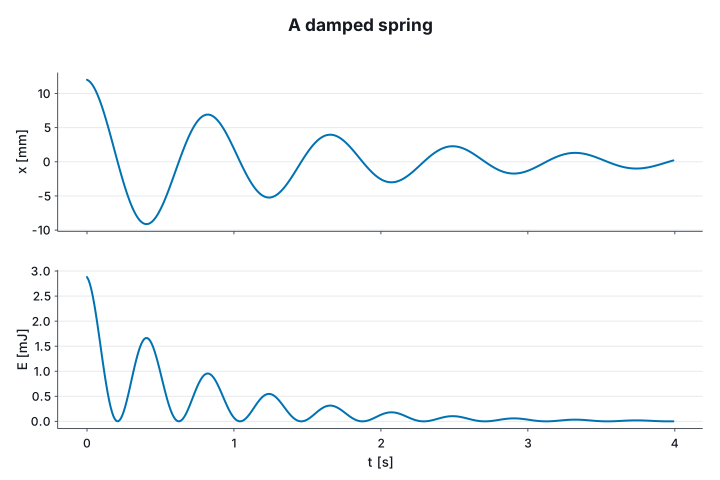
Nothing set an axis. The displacement was computed in metres and reads x [mm]; the energy,
½ k x² with k in N/m, is a float<J> because the compiler worked it out, and reads in mJ. The
time axis is written once, under the lower panel. The same value is a tikzpicture for a LaTeX
document, typeset in the document's font with siunitx units:
spring |> Chart.toSvg SvgBackend.render "spring.svg" (Chart.size 720.0 480.0)
spring |> Chart.withTheme Theme.tikz |> Chart.toFile TikzBackend.render "spring.tex" (Chart.size 720.0 480.0)
What it does
- Figures: thirteen kinds of mark, rules, spans and annotations; log, symlog, power and reciprocal scales; stated and named ticks; a second y axis and secondary axes through a map (§§1–4).
- Tables and statistics: the
plotblock, colour, shape and size channels, loess, bootstrap intervals in the statistic's unit, facets (§5). - Papers: panels on one grid, spans, mosaics, stated proportions, shared axes, insets, panel
letters, a journal's framed box, TikZ with
siunitx, vector PDF (§6). - Fields: derivatives in their units, heatmaps, contours, quivers, streamlines, line-integral convolution, phase portraits with fixed points classified (§7).
- Simulation: integrators typed by the shape of the state, invariants, events, Poincaré sections, grid solvers and fluids, on the CPU or the GPU (§8).
- Motion: animation as a function of time, the
scenestoryboard, films that hold their layout still, video, typeset formulas (§§9–10). - Live: figures in Verso notebooks, controls in units, zoom, pan and a readout, recordings that replay as films, a window, and the browser through Fable (§§11–13).
- C#: the same figures without units of measure, with units stated as arguments (§14).
The packages
| Package | |
|---|---|
Marey |
The packages below that need no native library or external program, in one reference. |
Marey.Core, Marey.Units |
Dimensions, unit witnesses, scales, colour, and the scene every backend draws. |
Marey.Plot |
Chart, the plot block, layout, themes, the storyboard. |
Marey.Anim, Marey.Fields, Marey.Sim |
Animation, fields, simulation. |
Marey.Interact, Marey.Html |
Live figures, and HTML for a notebook cell. |
Marey.Backend.Svg, Marey.Backend.Tikz |
SVG, and tikzpicture source for LaTeX. |
Marey.Backend.Skia |
PNG and vector PDF with text shaped by HarfBuzz. Brings SkiaSharp. |
Marey.Backend.Gpu |
The GPU, offscreen or in a window. Brings Silk.NET. |
Marey.Backend.Web |
A canvas in a browser, for a Fable app. |
Marey.Tools.Tex, Marey.Tools.Video |
Typeset text through latex and dvisvgm, video through ffmpeg. |
Marey.Verso |
The Verso notebook extension, loaded by #!extension Marey.Verso. |
Marey.Analyzers, Marey.Witnesses |
Fixes for a call missing the right unit witness: F# analyzers for Ionide and the CLI, and the same fixes over the compiler service. |
Documentation
- The site: the guide with its figures drawn in the page and the live one answering its slider, a gallery of every figure, and the API reference of every package.
- The guide, a tour of everything in fifteen sections, every block of it run by the test suite.
- Examples, standalone scripts and a notebook, also run by the test suite.
- Why Marey is like this: the case for a unit witness over a string label, what the other decisions cost, and when not to use the library.
- Compatibility and Not in 1.0.
- Changelog and Contributing.
Building
dotnet build
dotnet test
The suite holds property tests for the dimension algebra, the scales, ticks, interpolation, colour
and the scene; golden baselines in SVG and tikzpicture source; a pdflatex compile; ink checks
over the compiled TeX, the PNG and the PDF; the guide, the README and the examples run; and the
same baselines drawn under Fable and Node. Gates that need an external program report it absent
rather than fail, and MAREY_REQUIRE_TOOLCHAIN=1, which CI sets, makes an absent one a failure.
Status
Pre-1.0. The next release is 1.0.0, and Compatibility says what it will promise. MIT licensed.